Student achievement is the driving force behind Tyler Junior College’s mission: The College champions student and community success by providing a caring, comprehensive experience through educational excellence, stellar service, innovative programming and authentic partnerships. One of the four priorities of Tyler Junior College’s 2020-2026 Strategic Plan is Educational Excellence. Four key indicators, which are consistent with the College’s mission, have been chosen to measure student achievement: Persistence Rates, Completion Rates, State Licensing Exam Pass Rates and Working/Enrollment Rates within one year of completion. (note that some indicators have multiple metrics).
For each of our student achievement indicators, the following two metrics have been established:
- Target level of performance — the level of performance that the College seeks to attain in the near future,
- Minimum threshold — acts as a trouble indicator, which the College seeks to never fall below.
Priority for Educational Excellence
Strategy 1: Enhance student success by eliminating barriers that prevent students from achieving their educational and career goals
Action 1: Identify primary barriers to student success and completion
Action 2: Focus efforts to eliminate top five learning/educational barriers
Strategy 2: Enrich curriculum to meet the needs of current career expectations
Action 1: Work with students throughout their college journey to build career literacy, develop professional skills, enhance financial literacy and empower personal development
Action 2: Expand co-curricular learning opportunities
Action 3: Utilize up-to-date technological resources needed for students to transfer seamlessly into their post-graduate success
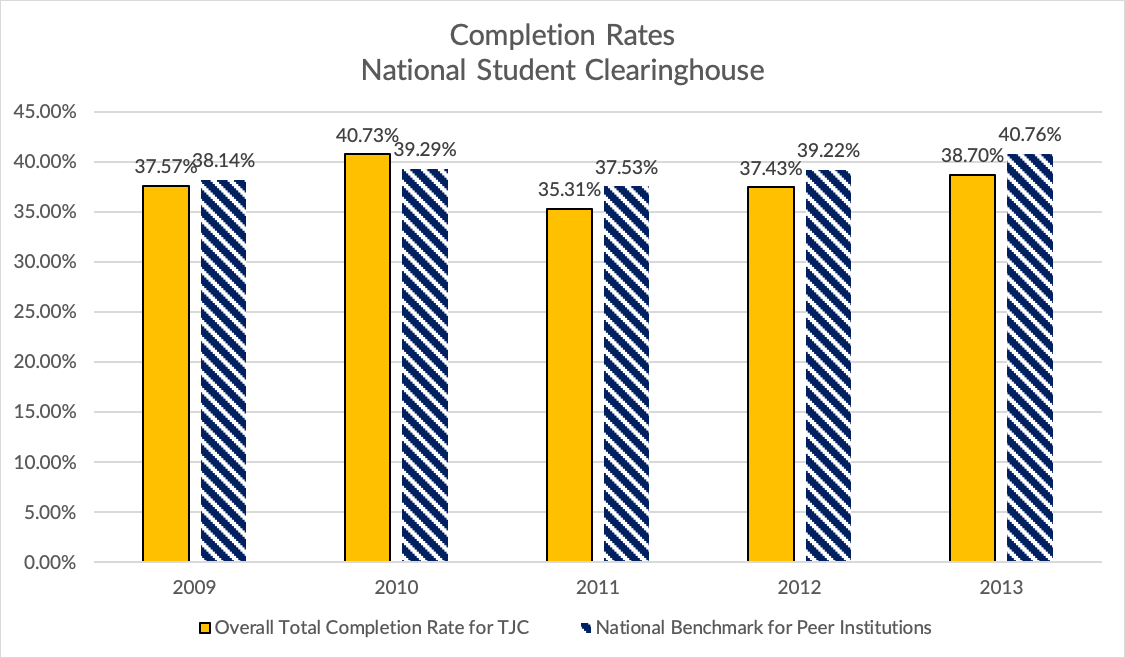
Completion
Increase six-year completion rate (as measured by the National Student Clearinghouse Overall Total Completion Rate)
Target: 41%
Minimum Threshold: 36%
Strategic Plan: Priority for Educational Excellence, Strategy 1, Actions 1 and 2
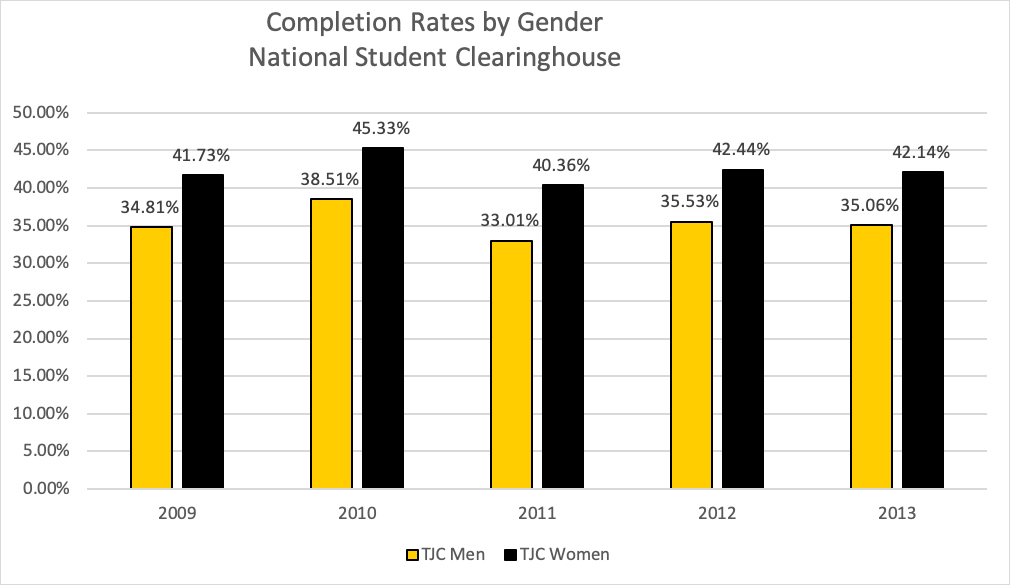
Disaggregated Completion Data
Six-Year Completion Rates by Gender
| Cohort | TJC Men | TJC Women |
|---|---|---|
| 2009 | 34.81% | 41.73% |
| 2010 | 38.51% | 45.33% |
| 2011 | 33.01% | 40.36% |
| 2012 | 35.53% | 42.44% |
| 2013 | 35.06% | 42.14% |
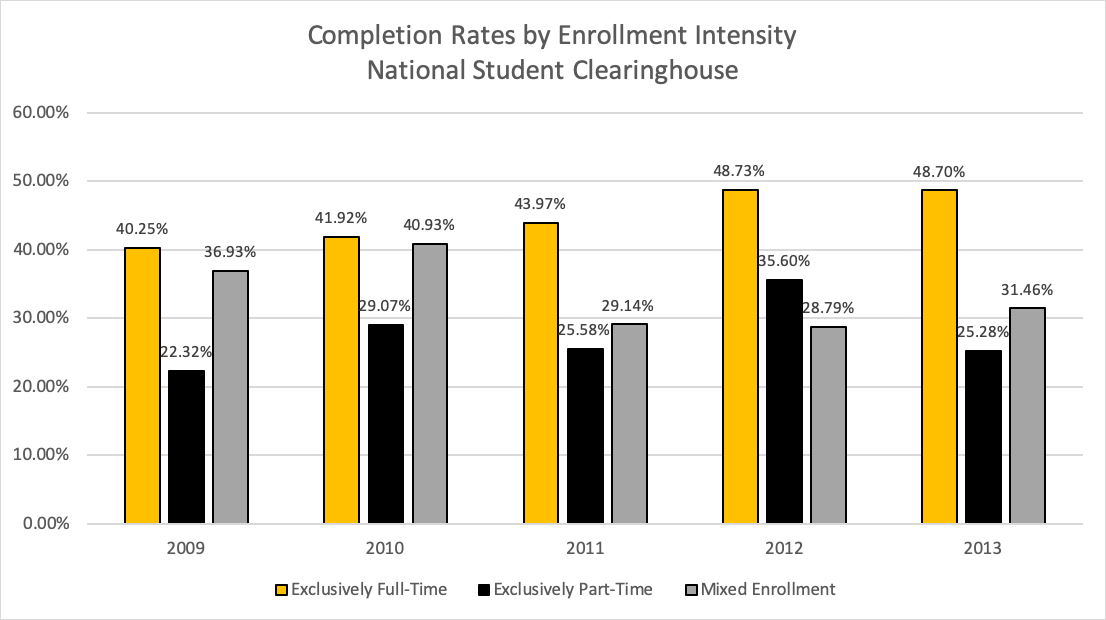
Six-Year Completion Rates by Enrollment Intensity
| Cohort | Exclusively Full-Time | Exclusively Part-Time | Mixed Enrollment |
|---|---|---|---|
| 2009 | 40.25% | 22.32% | 36.93% |
| 2010 | 41.92% | 29.07% | 40.93% |
| 2011 | 43.97% | 25.58% | 29.14% |
| 2012 | 48.73% | 35.60% | 28.79% |
| 2013 | 48.70% | 25.28% | 31.46% |
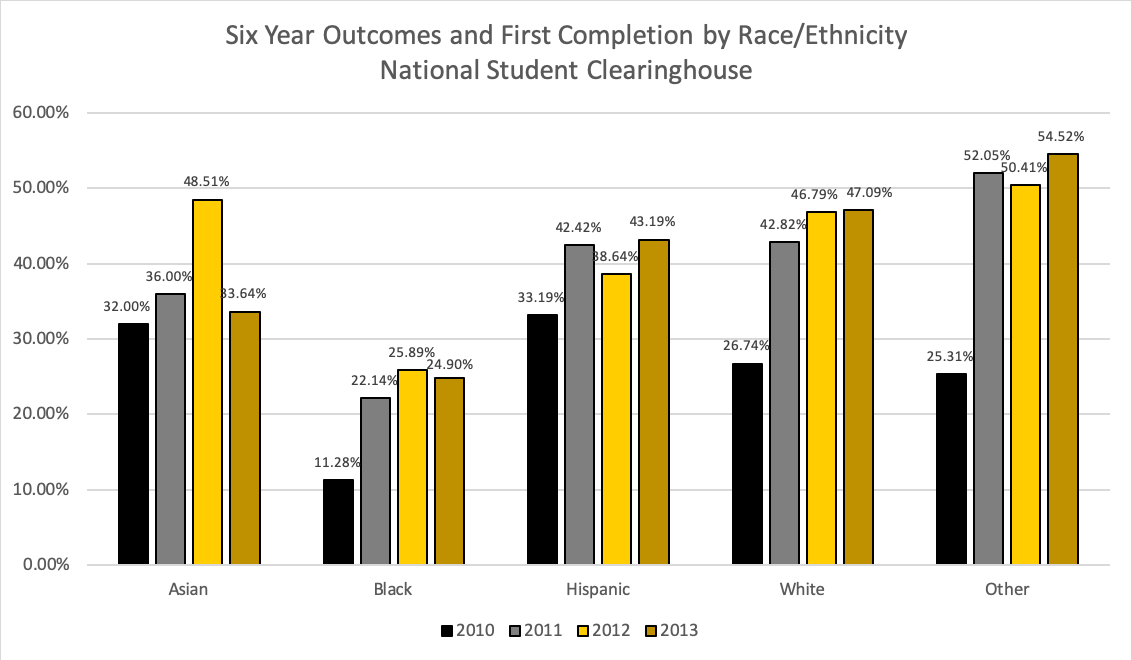
Six-Year Completion by Race/Ethnicity
| Ethnicity | 2010 | 2011 | 2012 | 2013 |
|---|---|---|---|---|
| Asian | 32.00% | 36.00% | 48.51% | 33.64% |
| Black | 11.28% | 22.14% | 25.89% | 24.90% |
| Hispanic | 33.19% | 42.42% | 38.64% | 43.19% |
| White | 26.74% | 42.82% | 46.79% | 47.09% |
| Other | 25.31% | 52.05% | 50.41% | 54.52% |
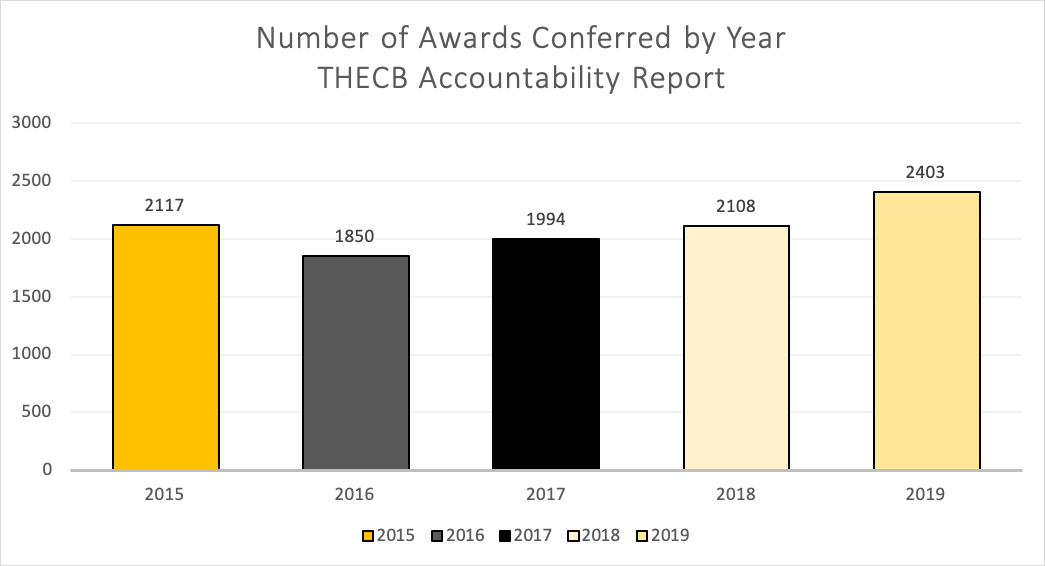
Number of Awards
Increase the number of awards (degrees and certificates) as measured by State of Texas data repository
Target: 2,524
Minimum Threshold: 2,017
Strategic Plan: Priority for Educational Excellence, Strategy 1, Actions 1 and 2; Strategy 2, Actions 1, 2, and 3
| 2015 | 2016 | 2017 | 2018 | 2019 |
|---|---|---|---|---|
| 2,117 | 1,850 | 1,994 | 2,108 | 2,403 |
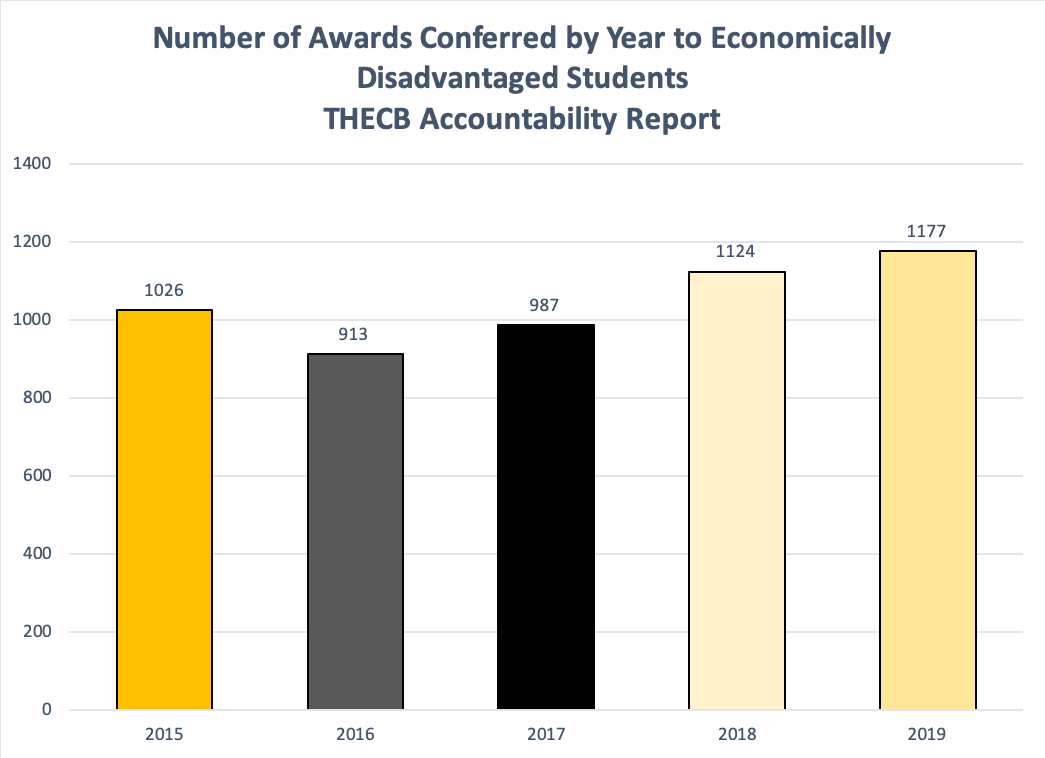
Number of Awards (Economically Disadvantaged)
Increase the number of economically disadvantaged undergraduates receiving an award as measured by State of Texas data repository
Target: 1,146
Minimum Threshold: 1,013 awards
Strategic Plan: Priority for Educational Excellence, Strategy 1, Actions 1 and 2; Strategy 2, Actions 1, 2, and 3
| 2015 | 2016 | 2017 | 2018 | 2019 |
|---|---|---|---|---|
| 1,026 | 913 | 987 | 1,124 | 1,177 |
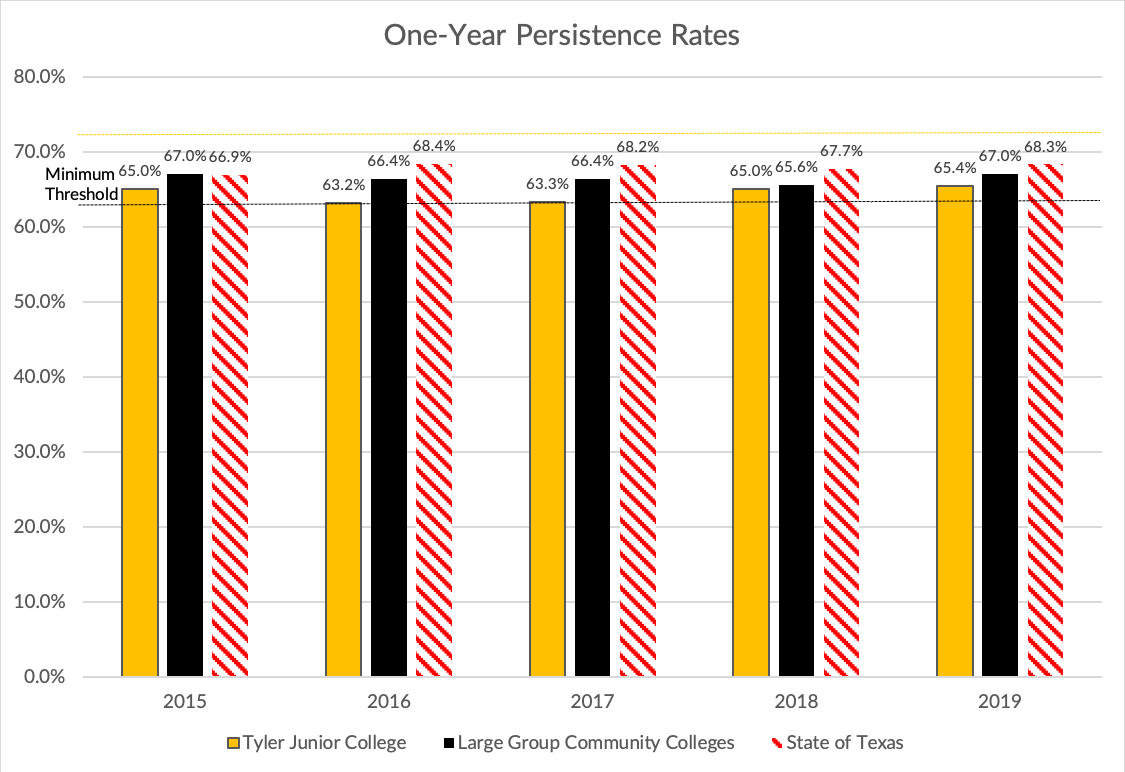
One-Year Persistence Rates
Increase the one-year persistence rates for first-time, degree-seeking undergraduates enrolled in at least 12 semester credit hours in the fall.
Target: 73 %
Minimum Threshold: 63%
Strategic Plan: Priority for Educational Excellence, Strategy 1, Actions 1 and 2; Strategy 2, Actions 1, 2, and 3
| One-Year Persistence Rates | 2015 | 2016 | 2017 | 2018 | 2019 |
|---|---|---|---|---|---|
| Tyler Junior College | 65.0% | 63.2% | 63.3% | 65.0% | 65.4% |
| Large Group Community Colleges | 67.0% | 66.4% | 66.4% | 65.6% | 67% |
| State of Texas | 66.9% | 68.4% | 68.2% | 67.7% | 68.3% |
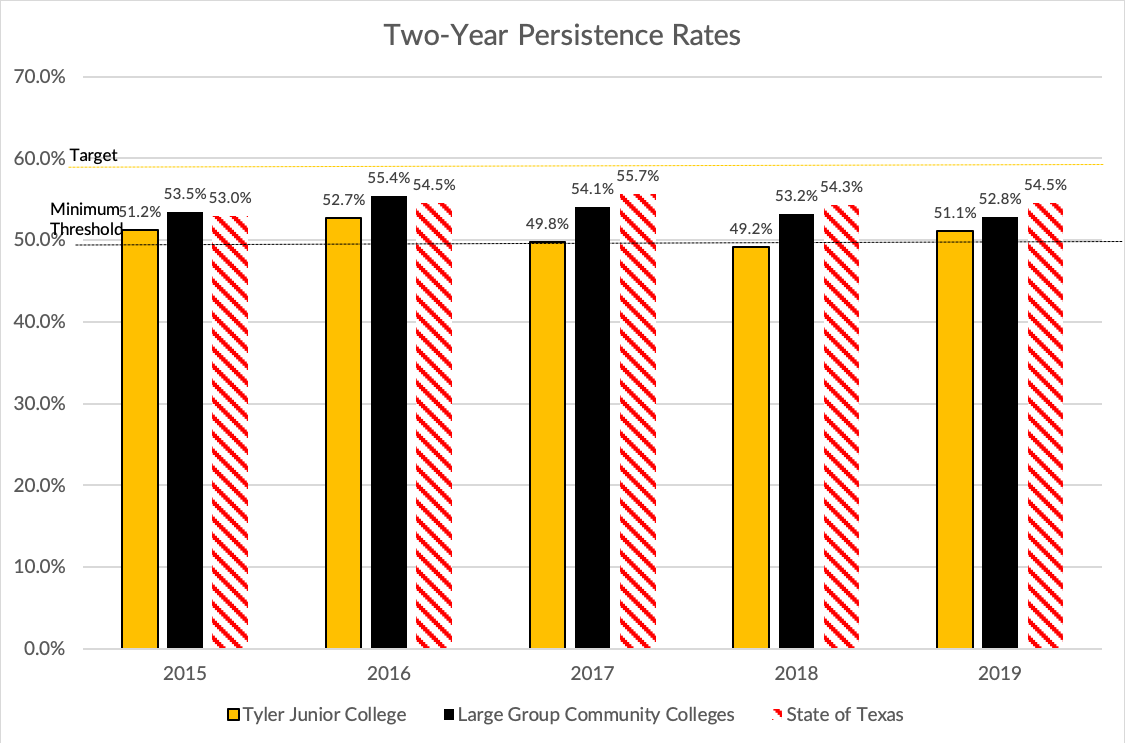
Two-Year Persistence Rates
Increase the two-year persistence rates for first-time, degree-seeking undergraduates enrolled in at least 12 semester credit hours in the fall.
Target: 59%
Minimum Threshold: 49%
Strategic Plan: Priority for Educational Excellence, Strategy 1, Actions 1 and 2; Strategy 2, Actions 1, 2, and 3
| Two-Year Persistence Rates | 2015 | 2016 | 2017 | 2018 | 2019 |
|---|---|---|---|---|---|
| Tyler Junior College | 51.2% | 52.7% | 49.8% | 49.2% | 51.1% |
| Large Group Community Colleges | 53.5% | 55.4% | 54.1% | 53.2% | 52.8% |
| State of Texas | 53.0% | 54.5% | 55.7% | 54.3% | 54.5% |
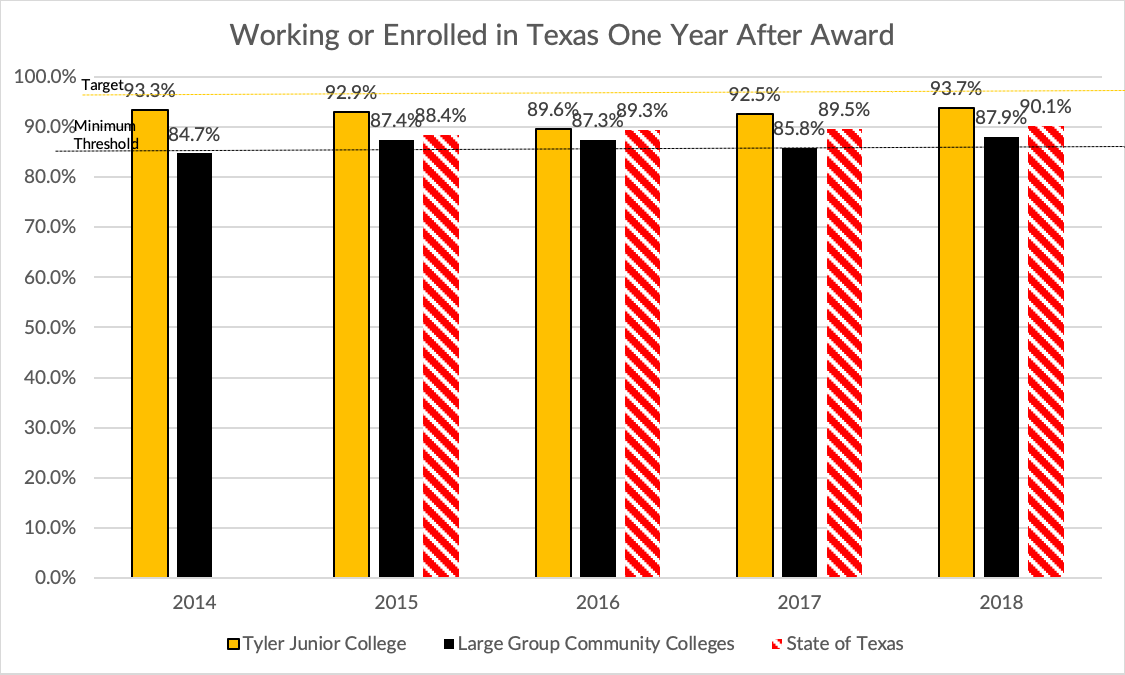
Working or Enrolled in Texas One Year After Award
Increase the percentage of students found working or enrolled in Texas within one year after earning a degree or certificate.
Target: 95%
Minimum Threshold: 85%
Strategic Plan: Priority for Educational Excellence, Strategy 1, Actions 1 and 2; Strategy 2, Actions 1, 2, and 3
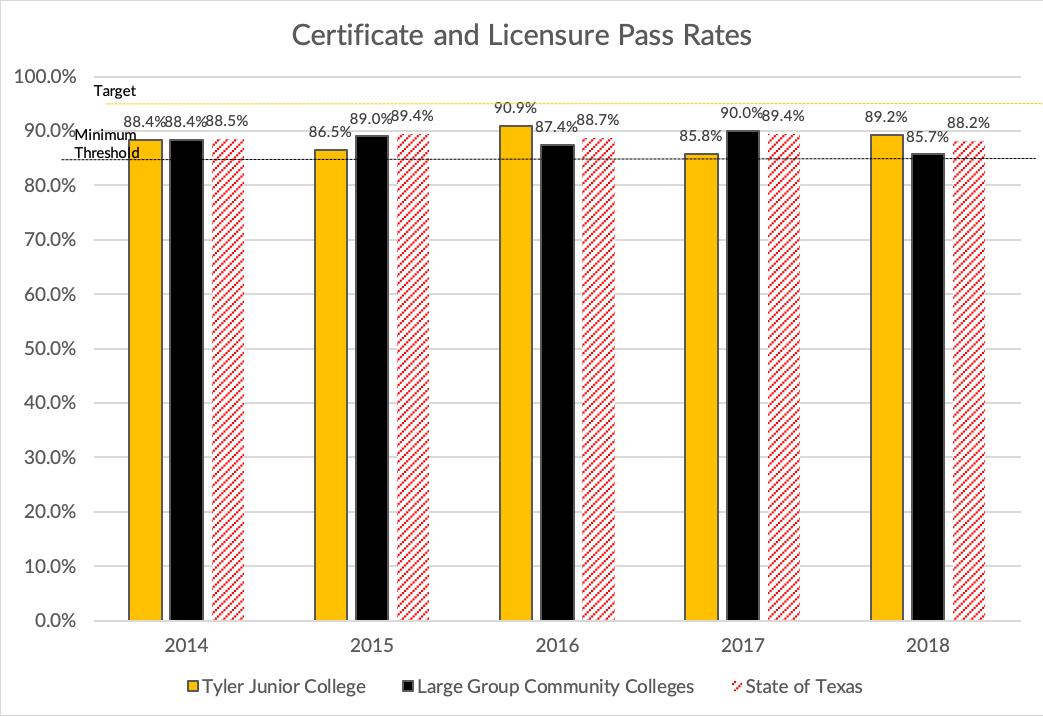
Certificate and Licensure Pass Rates
Increase the pass rate for students who take a certification or licensure exam in their discipline.
Target: 95% pass rate
Minimum Threshold: 85%
Strategic Plan: Priority for Educational Excellence, Strategy 1, Actions 1 and 2; Strategy 2, Actions 1, 2, and 3